Project Overview
This data analysis project examined factors influencing housing prices in Boston to create predictive models for future pricing. We analyzed various neighborhood characteristics to identify significant patterns that impact property values.
Key Questions
How do crime rates relate to housing prices in Boston?
What are the overall characteristics of houses ranging from cheap to expensive?
Is multicollinearity present in coefficient estimates from linear regression models when analyzing housing prices?
Dataset
Our analysis used the Boston housing dataset from the MASS package in R, which contains:
Data from 506 Boston suburban neighborhoods
14 variables including crime rates, number of rooms, accessibility to highways, etc.
Data compiled in 1978, providing historical perspective on housing market factors
Key variables analyzed included crime rate per capita, nitrogen oxide concentration, average number of rooms, distance to employment centers, highway accessibility, property tax rate, Charles River boundary status, and proportion of lower status population.
Methodology
We employed a comprehensive statistical approach using R:
Data wrangling to clean and transform the dataset for optimal analysis
Exploratory data analysis with visualization to understand relationships
Linear regression modeling with backward selection to identify significant variables
Variance Inflation Factor (VIF) analysis to detect multicollinearity
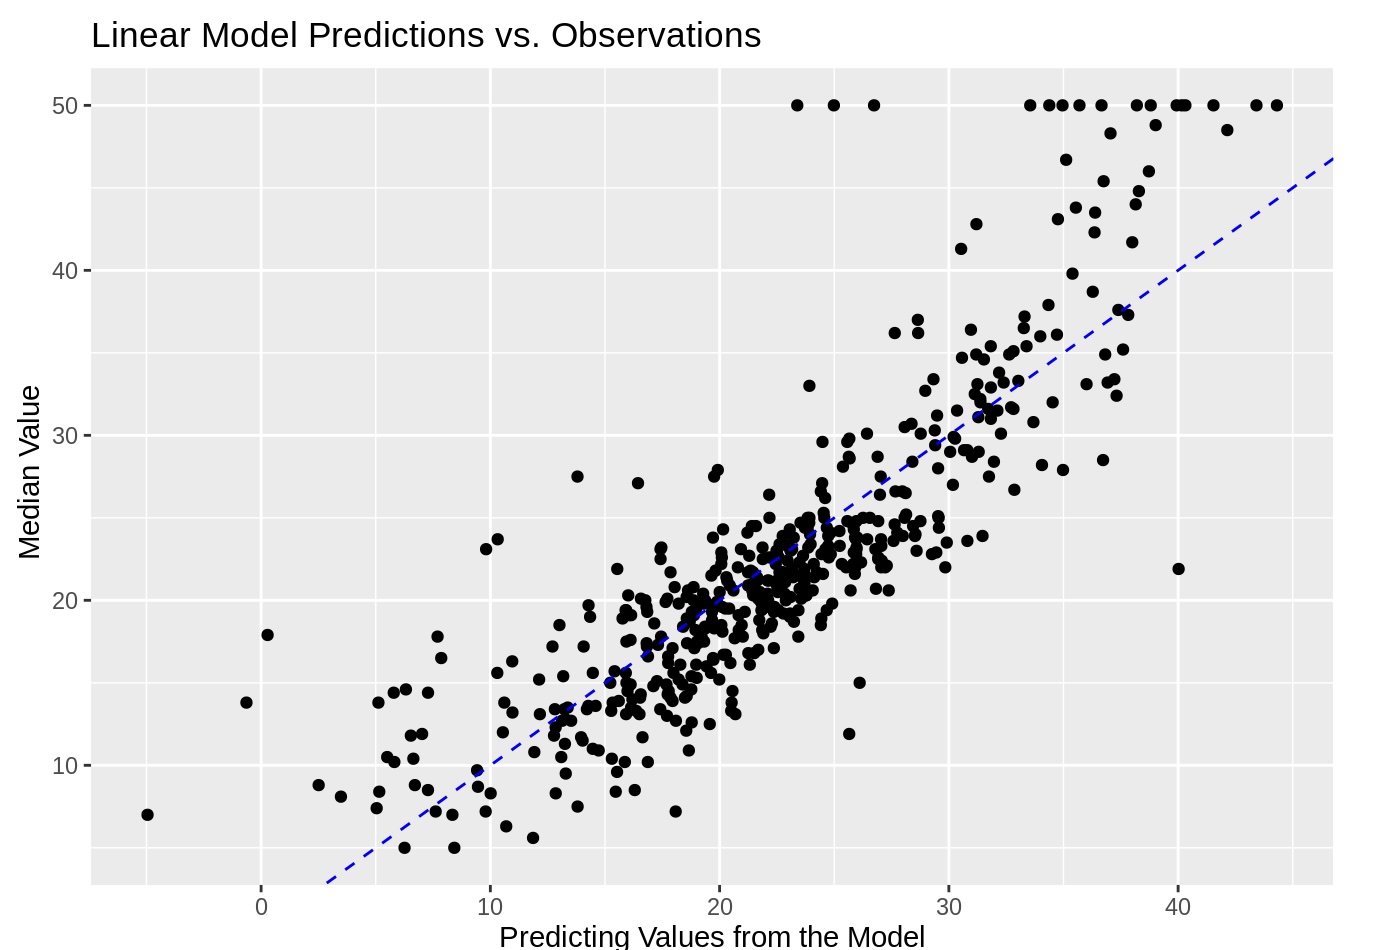
Comparison of predicted values versus actual observations to validate model accuracy
Tools Used
Our analysis was performed in R using packages including dplyr, tidyverse, tidymodels, skimr, ggcorrplot, GGally, and car for statistical testing.
The Model
Our final predictive model was derived using backward selection to include only statistically significant variables:
median housing prices = 14.2 - (0.102 * crimerate) - (9.61 * nitrogen) + (4.28 * rooms) - (1.56 * distance) + (0.227 * highway_access) - (0.016 * property_tax) + (0.009 * black_proportion) + (3.21 * river_bound) - (55.3 * lower_status) + (7.98 * residential_lots)
Model Performance
Model Accuracy
R-squared value of 0.712
Explains 71.2% of variance in housing prices
Age of houses and proportion of non-retail businesses were not significant
Variable Significance
Crime rate alone explained only 14.9% of variance
Number of rooms had strong positive correlation
Lower status population proportion had strongest negative effect
Key Findings
Crime Rate Impact
Crime demonstrated a clear negative relationship with housing prices. While crime rate alone accounts for only 14.9% of the variance, each percent increase in crime rate was associated with a housing price decrease of approximately $415.
Housing Characteristics by Price
High-Value Properties
Low crime rates
Low nitrogen oxide concentration
More rooms on average
Close to employment centers
Better highway access
Lower property tax
Often riverbound
Low-Value Properties
High crime rates
High nitrogen concentration
Fewer rooms on average
Far from employment centers
Limited highway access
Higher property tax
Rarely riverbound
Multicollinearity Results
VIF analysis revealed moderate to high multicollinearity among several variables:
Tax rate had highest VIF at 8.96
Highway access had VIF of 7.22
Nitrogen oxide concentration and distance to employment centers had VIF values around 4
These findings suggest caution when interpreting these variables, as they are not fully independent predictors
Conclusions
Our analysis successfully identified key factors affecting Boston housing prices, with several important takeaways:
Environmental and socioeconomic factors have significant influences on housing prices
Our model explains 71.2% of variance in housing prices using 11 variables
Property characteristics (rooms, location) and neighborhood qualities (crime, status) are both crucial factors
Proximity to amenities significantly increases property values
The remaining 28.8% unexplained variance suggests additional factors not captured in the dataset are also important
These findings provide valuable insights for real estate professionals, urban planners, and policymakers interested in understanding housing market dynamics in Boston and similar urban areas.
This project was completed in collaboration with Chaska Kentish and Charles Ye.